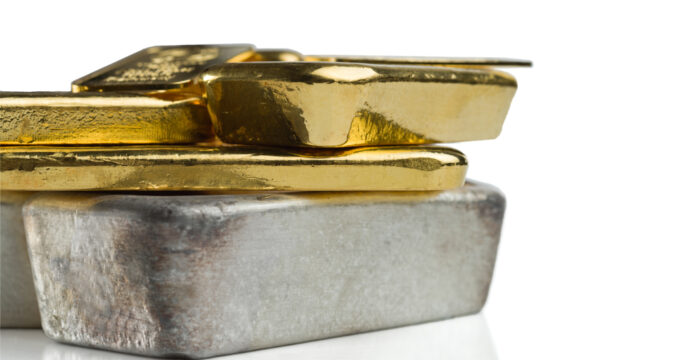
Gold and silver are two of the most abundant precious metals. While silver is often used as an industrial metal, gold is generally viewed as a store of value since it conducts electricity very well. The ratio between gold and silver is a reflection of supply and demand. The production of these precious metals is a function of their availability. The main demands include jewelry, store of value, and industrial use.
The history of the ratio between gold and silver is how traders tend to value each precious metal relative to the other. Historically, the ease of production has not been a guide to the ratio. Since this is the case, the demand side of the equation is likely more of a reason for the elevated levels of gold prices relative to silver prices. The gold to silver ratio generally peaks during periods of uncertainty when the demand for an alternative store of value is high. When a safe haven instrument such as gold is less in demand during robust economic times, the ratio usually declines. Additionally, silver price trading is generally more volatile than gold prices.
The History of the Ratio
The ratio of silver to gold in the earth’s crust dating back to Roman times is approximately 18 to 1. During this period, the significant disparity in the availability led to the ratio being set at 12 to 1. For example, if silver prices were trading at $10 per ounce, gold prices would be placed during this period at $120 per ounce. Fast forward to the year 1792. During this time in the United States, the gold to silver ratio was fixed at 15-1. In 1803 the ratio was set at 15.5 to 1 in France.
The Move to a Gold Floating Rate
Gold has held a place in currency valuation for centuries. In 1944, during an agreement at Bretton Woods, currencies were fixed to the value of gold. This framework generated a fixed currency exchange system. All 44 countries that met agreed to uphold the fixed exchange rate and trade around their currencies to make sure it remained stable to the price of gold. This system called for the creation of the International Monetary Fund to evaluate the exchange rate of currencies worldwide. In the early 1970s, this system collapsed. U.S. President Richard Nixon notified the world that the dollar would now float as a market exchange rate and suspend its fixed rate against gold prices. The change to a floating rate also released the fixed ratio of gold to silver.
If the U.S. dollar were no longer tied to gold prices, gold prices would experience more volatility as there’d be less interest in holding gold in reserves. Eventually, the U.S. dollar became the world’s reserve currency. With fewer gold reserves, the yellow metal could experience more price volatility. This move also released the close relationship between silver and gold as now this ratio could float freely in the marketplace.
Production Data Has a Limited Impact on the Gold-Silver Ratio
The availability of silver relative to gold in the earth’s crust has only a tiny impact on the ratio of gold to silver. According to the U.S. Geological Survey’s Mineral Commodity Summaries, reserves and silver production were 9 to 10 times as abundant as gold. In addition to the abundance and production data, which favors silver relative to gold, silver inventory held above ground is constantly drawn down because silver is used for industrial purposes.
The ratio of Gold to Silver
The 20-year trading average of the ratio of silver to gold is approximately 67. If production were the only roadmap, the price of silver would be about 10% of the value of gold. Silver prices would be closer to $180 per ounce instead of $23 per ounce. You can see that the long-term 20 year monthly moving average of the gold to silver ratio ranges from 43 to 70. During the past 50 years, the range peaked near 120 and troughed near 13. The trough in the ratio occurred in March of 1980 when the Hunt brothers attempted to corner the silver market. The peak occurred during the beginning of the COVID-19 pandemic.

The Bottom Line
Gold and silver have long histories as precious metals used as currencies. Changes in the ratio started to occur in the 1970s when the U.S. went off the gold standard. This situation allowed the U.S. dollar to float and created a scenario where gold reserves were replaced with U.S. dollar reserves. Production availability is less of a determining factor in the value of gold to silver. Production available shows that silver is 10 times more accessible than gold. The changes to the ratio are likely more of a function of demand for a store of value. The historical ranges of the ratio in the past 50 years have been extensive, while the 20 year moving average has fluctuated in a 27 ratio range.


